
30 Apr Particle Image Velocimetry (PIV) Uncertainty Quantification Using Moment of Correlation (MC) Plane
The uncertainty in a planar PIV measurement has been a topic of great interest in the last decade. Here, we present a new direct uncertainty estimation method for Particle Image Velocimetry (PIV), that uses the correlation plane as a model for the probability density function (PDF) of displacements and calculates the second order moment of the correlation (MC). The cross-correlation between particle image patterns is the summation of all particle matches convolved with the apparent particle image diameter. MC uses this property to estimate the PIV uncertainty from the shape of the cross-correlation plane. In this new approach, the Generalized Cross-Correlation (GCC) plane corresponding to a PIV measurement is obtained by removing the particle image diameter contribution. The GCC primary peak represents a discretization of the displacement PDF, from which the standard uncertainty is obtained by convolving the GCC plane with a Gaussian function. The performance of this correlation-plane based uncertainty estimate is compared with the existing methods and validated for a wide range of 2D PIV data.
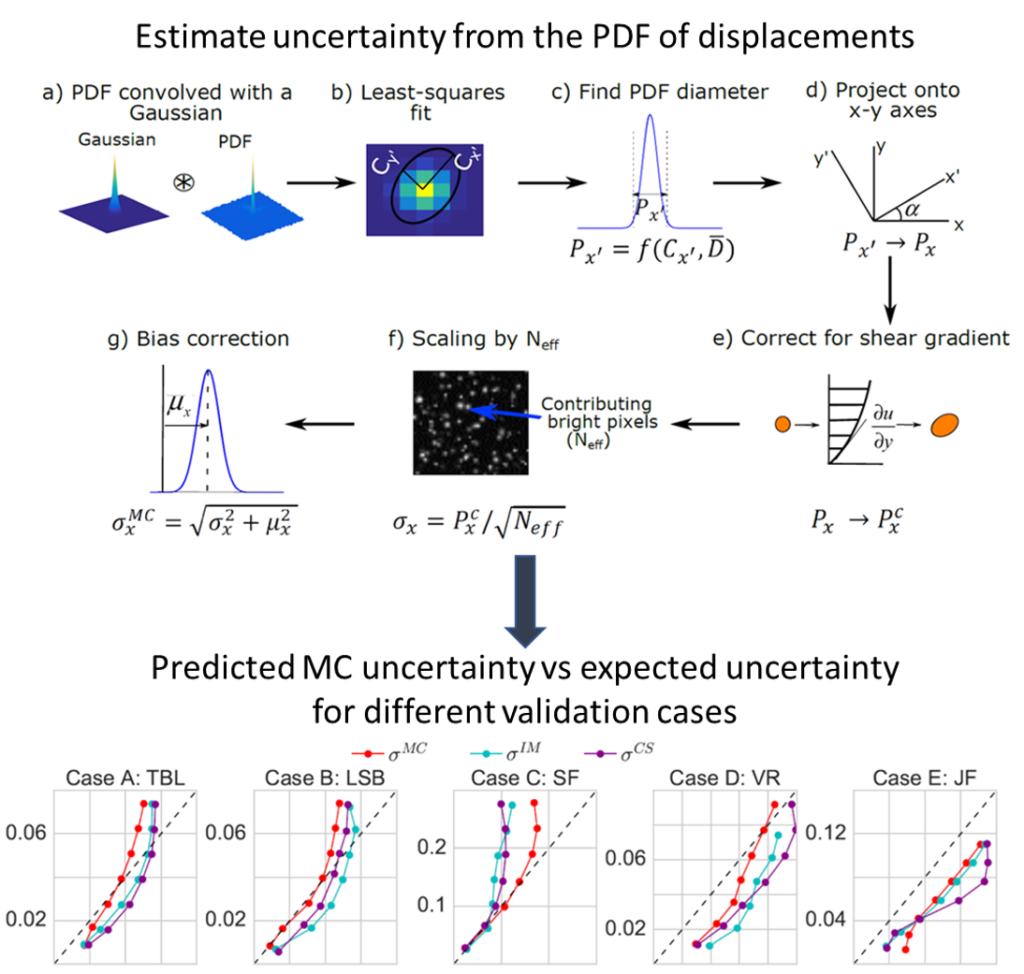
The performance of MC uncertainty prediction is compared with the true RMS error (black line) and the existing IM and CS methods for different test cases. Subplot a) shows the uncertainty histogram with the RMS value denoted by the vertical dashed lines. Subplot b) demonstrates the spatial variation of the predicted uncertainties while subplot c) shows the uncertainty coverage for each method for all cases (processed with different window size). The expected coverage is shown by the black dots.

No Comments